∙
Cooper
∙
Reading time:
14 min

Slack can be more than just a chat tool - it can be a productivity powerhouse if you track the right metrics. Teams often face issues like wasted time on repetitive tasks, difficulty finding information, or delays in decision-making. By focusing on metrics like message flow, response times, and channel activity, you can identify bottlenecks, improve transparency, and streamline team communication.
Here’s what you’ll learn:
Message trends: Are conversations open (public channels) or siloed (DMs)?
Channel activity: Who’s engaging, and are any channels inactive or underutilized?
Response rates: How quickly are teams addressing messages or approvals?
Knowledge sharing: Are employees finding answers easily, or are they stuck repeating questions?
Tracking these metrics isn't about micromanaging - it’s about improving workflows and ensuring teams can collaborate effectively. For example, public channels can make critical information searchable and prevent repeated questions. Tools like Slack’s analytics and third-party platforms (e.g., Question Base) can provide deeper insights, helping you turn Slack into a true collaboration hub.
Get ready to understand how to measure what matters in Slack and make data-driven improvements to your team’s communication.
Automatic analytics & KPI reports for Slack
Core Collaboration Metrics to Track in Slack
Essential Slack Collaboration Metrics to Track for Team Performance
Tracking the right metrics can turn Slack into a powerhouse for team collaboration, not just a messaging tool. By focusing on how work flows through your Slack workspace, you can uncover patterns that improve transparency, engagement, and responsiveness. These metrics fall into three main buckets: message trends that highlight openness, channel activity that reveals participation, and reaction data that measures responsiveness.
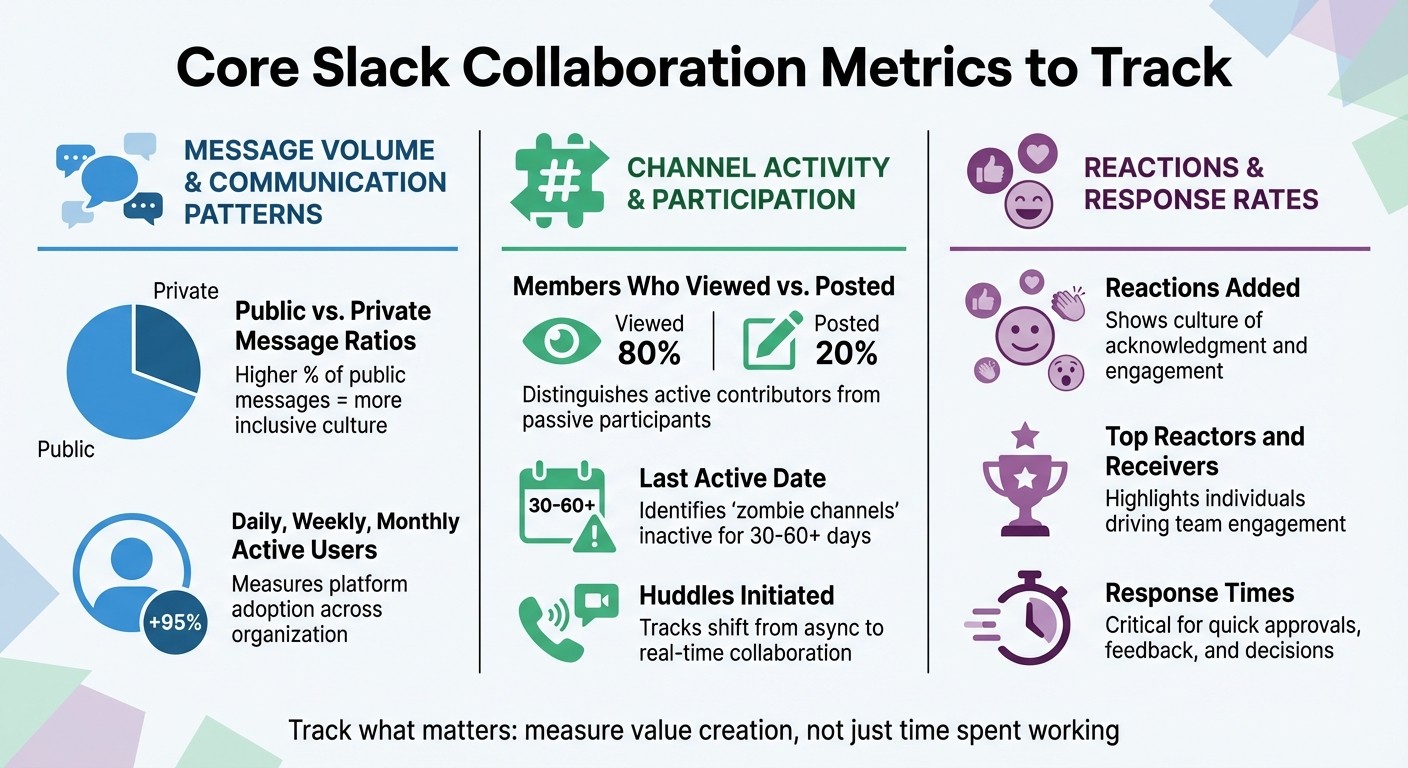
Message Volume and Communication Patterns
Public vs. private message ratios are a key indicator of how open or siloed your communication is. When most conversations happen in public channels, information becomes easily searchable and accessible to everyone. This kind of openness fosters knowledge sharing and collaboration across teams. A higher percentage of public messages suggests a more inclusive communication culture [6]. By tracking where messages are sent - whether in public channels, private groups, or direct messages - you can identify when important discussions are being confined to private threads [3][7].
Daily, weekly, and monthly active users provide a snapshot of how widely Slack is being adopted in your organization. These counts reflect the number of unique users engaging with the platform, offering a baseline for measuring engagement [1][3]. Slack’s own research emphasizes that "the goal is to measure value creation, not just time spent working" [2]. For example, a sudden spike in message volume could indicate confusion or inefficiencies in workflows.
Channel Activity and Participation
Members who viewed vs. posted helps distinguish between active contributors and passive participants. While some team members may not post frequently, they could still be absorbing critical information for their work. However, if entire channels show low posting rates, it might signal low engagement or a lack of clarity about the channel’s purpose [1].
Last active date is another useful metric, helping you identify "zombie channels" that clutter your workspace. Channels without activity for 30 or 60 days may need to be archived or consolidated [1][3]. Similarly, tracking huddles initiated reveals when teams shift from asynchronous communication to real-time collaboration, such as through audio or video discussions [1].
Reactions and Response Rates
Measuring responsiveness is just as important as tracking participation. Reactions added go beyond simple emoji use - they show a culture of acknowledgment and responsiveness. High reaction counts indicate that team members are actively engaging with each other’s contributions, creating a positive feedback loop [1][6]. Metrics like top reactors and receivers can also highlight individuals who are driving engagement within the team [6].
Response times are critical for cross-functional teams that rely on quick approvals, feedback, or decisions. Delays in response often point to bottlenecks, unclear ownership, or teams that are overstretched. By combining insights from messaging trends, channel activity, and reactions, you can better understand how communication flows - and where it might be breaking down. This sets the stage for a deeper dive into cross-functional team dynamics in the next section.
Reading Metrics for Cross-Functional Teams
Once you've gathered collaboration metrics, the next step is making sense of them. The goal is to interpret these numbers to understand how cross-functional teams work together. Raw data alone doesn’t tell the full story - it needs analysis to highlight communication breakdowns, uneven workloads, and how well current policies are working. These insights can help fine-tune team dynamics and improve overall efficiency.
Finding Communication Bottlenecks and Silos
Metrics like message volume and channel engagement can reveal where communication silos are slowing down teamwork. For instance, a high number of direct messages or activity in private channels often points to isolated knowledge. When key information is locked away in DMs, it becomes unsearchable, leading to repeated questions and wasted time [3][6]. Research shows that many employees struggle to find the information they need, which can lead to poor decision-making [2].
If your organization uses SCIM (System for Cross-Domain Identity Management), you can analyze message viewers by department to see if information is being shared effectively across teams [3]. In Enterprise Grid setups, tracking multi-workspace channels and the percentage of active members participating in them can highlight whether collaboration is happening across business units [1][3]. If certain team channels have low engagement from other departments, it’s a sign of a silo that needs to be addressed.
Distributing Workload Across Team Members
Metrics around message and file-sharing activity can also point to workload imbalances. If a small group of employees dominates message counts, it may indicate that responsibilities aren’t evenly distributed. Similarly, team members heavily reliant on direct messages may be stuck in silos, spending extra time repeating information that could have been shared publicly [7].
Another key metric is workflow and app usage, which shows who is leveraging automation tools versus handling repetitive tasks manually [1]. This is especially important since desk workers already spend about one-third of their day on low-value tasks [2]. Additionally, junior employees often face challenges in remote environments, such as limited access to peers and managers, making workload visibility crucial for their success [6].
Testing Communication Policies with Data
Metrics can also help you assess whether your communication policies are supporting collaboration effectively. For example, Slack’s device usage report can show whether employees are accessing the platform via iOS, Android, or desktop. This data can help determine if "Do Not Disturb" policies are being followed across different devices and work modes [1][3]. If message activity remains high during focus hours, it might be time to revisit or reinforce these policies.
You can also monitor the use of AI-generated search summaries to understand how often employees rely on AI to locate information [1]. While Slack AI is great for summarizing conversations, teams that need verified answers often turn to tools like Question Base. Unlike Slack AI, which primarily learns from chat history, Question Base connects directly to trusted sources like Notion, Confluence, and Salesforce. It provides metrics like resolution rates and content gap analysis, helping teams evaluate whether their knowledge management strategies are reducing repeated questions and saving time for employees.
Tools for Measuring Slack Collaboration Metrics
While Slack's built-in analytics offer a decent foundation, enterprise teams often require more detailed data to truly understand collaboration dynamics across departments. By combining Slack’s native tools with specialized third-party solutions and AI-driven platforms, organizations can uncover richer insights into communication patterns. These tools go beyond simply measuring activity - they help teams identify areas for improvement in collaboration and knowledge sharing.
Slack's Built-In Analytics Dashboard
Slack’s native analytics dashboard provides an overview of key metrics like membership trends, daily and monthly active users, and message activity across channels [1][3]. For teams on paid plans (Pro, Business+, and Enterprise Grid), the dashboard offers additional details, such as channel-specific data on activity levels, membership counts, and engagement through posts and reactions [1][5].
However, there are some limitations. For instance, message activity reports are only available for public channels with at least 50 members [3]. Private channels and smaller team spaces are excluded from these standard analytics. Enterprise Grid users gain access to organization-level dashboards and private channel analytics, but this data is limited to workspace owners and admins [5][8]. To dig deeper, teams on Business+ or Enterprise+ plans can leverage the Public Channel Analytics API, which allows IT teams to integrate Slack data into broader business intelligence platforms for automated reporting [3].
Third-Party Analytics Tools
Third-party tools expand on Slack’s native capabilities by tracking metrics that standard analytics overlook. These include insights like first response times, resolution rates, and customer satisfaction metrics within support channels [8]. For example, platforms like Worknet not only provide custom leaderboards but also integrate Slack data with external tools like Zendesk or Intercom [8].
For internal support teams, Question Base stands out by focusing on knowledge management. It tracks answered questions, identifies repetitive queries, and pinpoints gaps in documentation. Unlike tools that rely on AI to generate summaries from past chats, Question Base connects directly to trusted sources like Notion, Confluence, and Salesforce to deliver verified answers. Teams can also monitor key metrics like resolution rates, the percentage of automated responses, and the frequency of unhelpful answers - insights that directly impact productivity.
AI Tools for Knowledge Management
Slack’s AI features, such as conversation summaries, are helpful for quick navigation. But when it comes to managing accurate, large-scale knowledge, dedicated AI tools offer more precision and control. A recent study found that 47% of digital workers struggle to locate critical information, while 32% have made poor business decisions due to inaccessible knowledge [2].
Purpose-built AI platforms like Question Base take things further by transforming Slack conversations into organized, searchable documentation. When a question is asked in Slack, Question Base pulls verified answers from official sources, tracks whether the response resolves the issue, and flags unanswered queries. This creates a feedback loop that highlights gaps in documentation and suggests areas for improvement. With SOC 2 Type II compliance and an option for on-premise deployment, Question Base is tailored for enterprise teams in HR, IT, and operations that prioritize both accuracy and security [8].
Setting Collaboration Goals with Metrics
Creating Baseline Measurements
Start by understanding how your team currently uses Slack. Define its role, highlight its benefits, and connect these to your broader business objectives [4]. This foundational vision will guide you in selecting the most relevant metrics.
Track adoption through daily and weekly active users, and measure engagement by looking at threaded discussions, reactions, and participation rates [7]. Analyzing the ratio of public to private messages can also offer insight into team transparency [7][3]. Combine these quantitative metrics with qualitative feedback to get a well-rounded view.
"The most valuable insights often come from combining quantitative tracking data with qualitative feedback from team members about their experience" [2].
Once you've established this baseline, you can develop clear and targeted KPIs.
Defining Team-Specific KPIs
Align your overarching goals with specific Slack activities. For example, if you're aiming to strengthen team culture, focus on metrics like the number of public channels created or the average messages per member [4]. If cost efficiency is a priority, track how many projects are managed entirely within Slack, using public channel activity as a key indicator [4].
Goal Category | Desired Slack Behavior | Potential KPI |
|---|---|---|
Strong Culture | Make work searchable across the team | # of public channels; messages/member [4] |
Financial Discipline | Execute projects solely in Slack | Messages in public channels; channel views [4] |
Leverage member analytics to identify "power users" - those who are highly engaged and can act as champions to onboard others into new workflows [4][7]. For cross-functional teams, monitor the ratio of DMs to channel messages. A high DM count might signal work being siloed, which can hinder transparency [7].
These tailored KPIs build on your baseline data, helping to align your team more effectively. Regularly revisiting these metrics ensures ongoing improvement.
Reviewing and Adjusting Goals
Review your metrics frequently - monthly cycles work well for tracking shifts in engagement and behavior [1][3]. Slack's dashboard, for instance, can automatically calculate percentage changes in member activity by comparing the past 30 days with the previous 30 days [1][3].
Use 1:1 meetings to connect individual productivity goals with team-wide metrics. Interestingly, research shows that 27% of executives gauge productivity by tracking visibility and activity (like time spent online), while only 19% prioritize results tied to KPIs and goals [9]. Shifting the focus from time spent working to actual outcomes can make a big difference.
"The goal is to measure value creation, not just time spent working" [2].
Regular reviews can also highlight inefficiencies. For instance, studies suggest that about 43% of meetings could be eliminated without any negative impact [9]. If your metrics reveal low engagement during certain collaboration windows, consider adjusting meeting schedules or experimenting with asynchronous workflows. This flexibility can help refine your team's approach over time.
Conclusion
Tracking Slack metrics isn’t about monitoring employees - it’s about ensuring smooth communication and alignment. By focusing on key metrics like the balance of public versus private messages or response times across channels, you can identify and address bottlenecks before they impact entire projects. Remember, when information access falters, it can lead to costly decision-making errors - issues that thoughtful metrics can help you avoid.
"The goal is to measure value creation, not just time spent working." – Slack Workforce Lab
The emphasis should always be on outcomes, not just activity. Are vital discussions happening in public, searchable channels, or are they locked away in DMs? Are team members quickly finding the answers they need, or are they wasting hours digging through old threads? These insights help you fine-tune your workflows for better efficiency.
For teams managing a high volume of internal questions, Question Base is the perfect complement to your metrics toolkit. While Slack AI focuses on summarizing past conversations, Question Base takes it a step further by transforming your trusted documentation in tools like Notion, Confluence, and Salesforce into actionable insights. It turns your Slack workspace into a dynamic knowledge hub, tracking resolution rates and identifying content gaps to provide guidance far beyond basic usage data.
FAQs
Which Slack metrics matter most for collaboration?
Key Slack collaboration metrics provide valuable insights into how teams communicate and where improvements can be made. These include message volume, engagement rate, response time, channel activity, and search analytics. By analyzing these areas, teams can uncover patterns, identify bottlenecks, and address knowledge gaps.
For instance, monitoring response time sheds light on how quickly team members address inquiries, offering a measure of efficiency. Meanwhile, search analytics can pinpoint where documentation might be lacking, helping teams fill those gaps. When combined, these metrics enable teams to streamline workflows, enhance communication, and encourage better knowledge sharing.
How do I spot silos and bottlenecks using Slack data?
To spot silos and bottlenecks in Slack, keep an eye on metrics such as message volume and engagement rates across your channels or teams. If you notice low interaction, it might point to silos forming, while unusually high message volume could signal bottlenecks in workflows. Prolonged response times in particular channels are another red flag, often indicating delays that slow down overall productivity. By reviewing channel activity and tracking resolution metrics, you can identify weak points in collaboration or documentation. This insight allows you to fine-tune workflows and boost communication efficiency.
How can I measure knowledge sharing and repeated questions in Slack?
To get a handle on knowledge sharing and repeated questions in Slack, focus on metrics like message volume, engagement rates, and search activity. Slack’s built-in analytics dashboards can reveal patterns, such as frequently asked questions and recurring topics. Tools like Question Base take this further by organizing shared knowledge, identifying duplicate queries, and delivering expert-approved answers. This not only cuts down on repetitive questions but also strengthens your team’s documentation and knowledge-sharing processes.